Reading Figures and Tables with Multimodal RAG
- #AI
- #RAG
- #Multimodal
- #VLM
- #LLM
Most new AI techniques are introduced in research papers first. Keeping up with the field means reading papers, and lately I've been working through some well-known ones — "Attention Is All You Need" among them. But papers are in English, packed with unfamiliar terminology and notation, and often the real insight is buried in a figure or a table rather than the prose. Reading even one takes a long time.
When I got stuck I'd ask an LLM for help — copy a paragraph in, ask what it means. But figures and tables aren't text, so there was no easy way to ask about them. I kept wishing for a tool that could take a whole paper and explain it, figures and tables included.
While building a chatbot that reads PDFs mixing tables, charts, and images, that earlier frustration came back to me. So I decided to put what I'd been learning to use and build a paper-reading chatbot myself.
This post focuses on how I implemented the figure and table reading in particular.
Project Overview
The chatbot reads a paper and answers questions about it in whatever language you ask in. You can upload a PDF directly or search for a paper by keyword on arXiv — an open repository where most AI and science papers live — and the chatbot will explain the content and answer questions about it.
The chatbot runs on RAG. It reads the paper first, chops it into pieces, and stores them; when a question arrives it retrieves the relevant pieces and hands them to an LLM as evidence. The model never has to read the whole paper at once, and grounding answers in retrieved evidence cuts down on hallucination.
Text alone isn't enough, though. A paper's core contribution is often in an architecture diagram or a results table. Answering "explain this figure" or "what do the Table 2 results say" requires reading figures and tables too.
Basic Structure
Let's start by setting aside figures and tables for now, and build the simplest possible RAG chat app that reads text only. The pipeline has two stages: indexing and answering.
- Indexing — store the paper in advance. Extract text from the PDF with
pypdf, split into 500-character chunks (50-character overlap), embed each chunk into a 1,536-dimensional vector withtext-embedding-3-small, and store everything in local Chroma. - Answering — when a question arrives, embed it and retrieve the 5 nearest chunks;
gpt-4o-minithen answers in the question's language using those chunks as evidence.

The chat interface uses Streamlit, the backend API is FastAPI, vector search runs on Chroma, and embeddings and generation come from OpenAI. The prompt includes an instruction to say "I don't know" if the answer isn't in the paper, to prevent the model from making things up.
That's the baseline. It handles concepts, contributions, and summaries mentioned in prose, but it can't answer questions about figures or tables — because it only reads text. Making it read figures and tables is the point of everything that follows.
Evaluation
Before adding figure and table support, I need a way to measure change in numbers. Without measurement, it's easy to mistake useless work for progress.
I write 18 questions about the Attention paper and split them evenly — 6 whose answers are in the body text, 6 in tables, and 6 in figures. A separate LLM scores each chatbot answer on two criteria: whether it sticks to the retrieved evidence (faithful) and whether it covers the key points (covers), each scored 0 or 1.

I run the baseline through this eval set to establish a starting point. The covers score for table questions is 67%; for figure questions it's 83%. The reason figure questions score well even with text-only retrieval is that the paper's prose already describes the figures ("Figure 1 shows an encoder and decoder…"). These numbers are the reference; I'll watch whether they improve once I add figure and table reading.
Reading Tables
Tables are first. The plan is to find tables in the PDF, convert them to Markdown tables, and store them alongside the text chunks. In Markdown form, row and column structure survives as characters, which makes it much easier for the LLM to read.

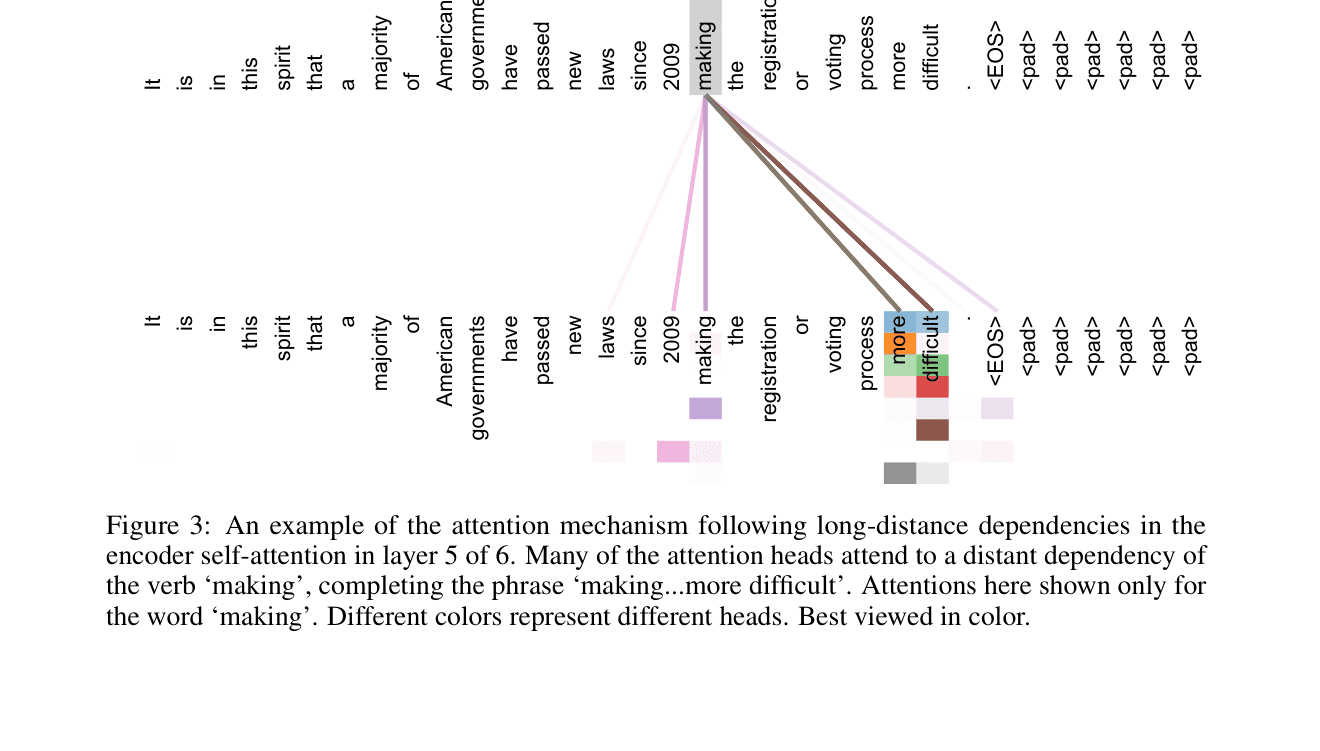
pdfplumber's line-based table detection fails on the borderless tables common in papers, and mistakenly reads the paper's attention visualization page — a grid of words and colored cells — as a large table of mostly empty and single-character cells. I add a filter that checks row and column count plus the empty-cell ratio to keep only genuine tables.
After adding the filter and re-running the eval set, the table covers score stays at 67%. The reason is simple: the numbers in the tables are already in the text. When pypdf extracts text, values like 28.4 and 41.8 come out on a single line, so extracting tables separately and converting them to Markdown adds no new information to the search index.
What this reveals is worth noting: extracting a table and reflecting its contents in an answer are two different things. Without an eval set, it's easy to convince yourself that this kind of work made a difference. So I stop here with tables — genuine tables are extracted and stored as Markdown, spurious ones are filtered out, and that's enough. The type and page metadata I attach to each chunk will be useful later: type filters by chunk kind during retrieval, and page is shown as a source reference. The place multimodal support is truly needed is figures, where there's no text at all.
Reading Figures
Tables at least contain characters. Figures have no text to search. Embeddings work by turning text into vectors — with no text, a figure never shows up in retrieval results.
The approach is to turn figures into text. Pass the image to a multimodal model (VLM) and get back a caption, then store that caption alongside the text chunks. Now a question like "explain this figure" will match the caption in retrieval.

Extracting figures has a catch. Most figures in papers are drawn as vector graphics — shapes and lines — so page.get_images(), which pulls raster images embedded in the PDF, returns 0 results. Instead, if a page has more than a threshold number of drawn vector shapes and no embedded raster image, I render the whole page as a PNG and send it to the VLM.
Evaluation Reliability
When I add figure captions and re-run the eval set, the figure score doesn't improve. Worse, running the same paper through the same index twice gives scores of 83% and 50%. The data hasn't changed.
Before touching the feature further, I check the measurement tool. Two causes turn up: the scoring LLM was judging the same answer differently each run (fixed by setting temperature=0 and locking seed), and the answers were in Korean while the reference keywords were in English, making scoring inconsistent (fixed by scoring semantically and aligning keyword language).

The lesson here was significant: when scores don't move, check the measurement tool before touching the feature. You can't trust decisions made on top of untrustworthy measurements.
Search Interference
With measurement fixed, the real problem becomes visible. Adding figure captions drops the text question score from 83% to 67%. Each question uses the top 5 nearest chunks as evidence — but figure caption chunks are now landing in those top 5 and pushing needed text chunks out.

The fix is to narrow the search based on the question's intent. When storing chunks, I tag each with a type metadata field (text, table, or figure). When a question arrives, I check whether it mentions words like "figure" or "table" to decide which types to search. For figure questions I search figures and text only; for table questions, tables and text only. I apply a metadata filter in the vector search to narrow the candidate pool before picking the top 5.
With this rule in place, the text question score comes back to 83% and adding more modalities no longer hurts the overall score. Adding more modalities doesn't automatically help — mixing them incorrectly makes them interfere with each other in retrieval.
Prompt Improvement
Now the evidence going into each answer can include chunks from tables, figures, and body text together. But if I concatenate them without context, there's no way for the model to tell which is a table and which is a figure, or which page it came from. So I tag each chunk with its type and page ([Table, p.8], [Figure, p.3]) and add a rule to the system prompt: "if you're drawing on a specific table, figure, or page, cite the source."
The retrieval didn't change — only how the model is told to read the evidence. That change alone raises the table question covers score from 67% to 83%.
Reading Charts
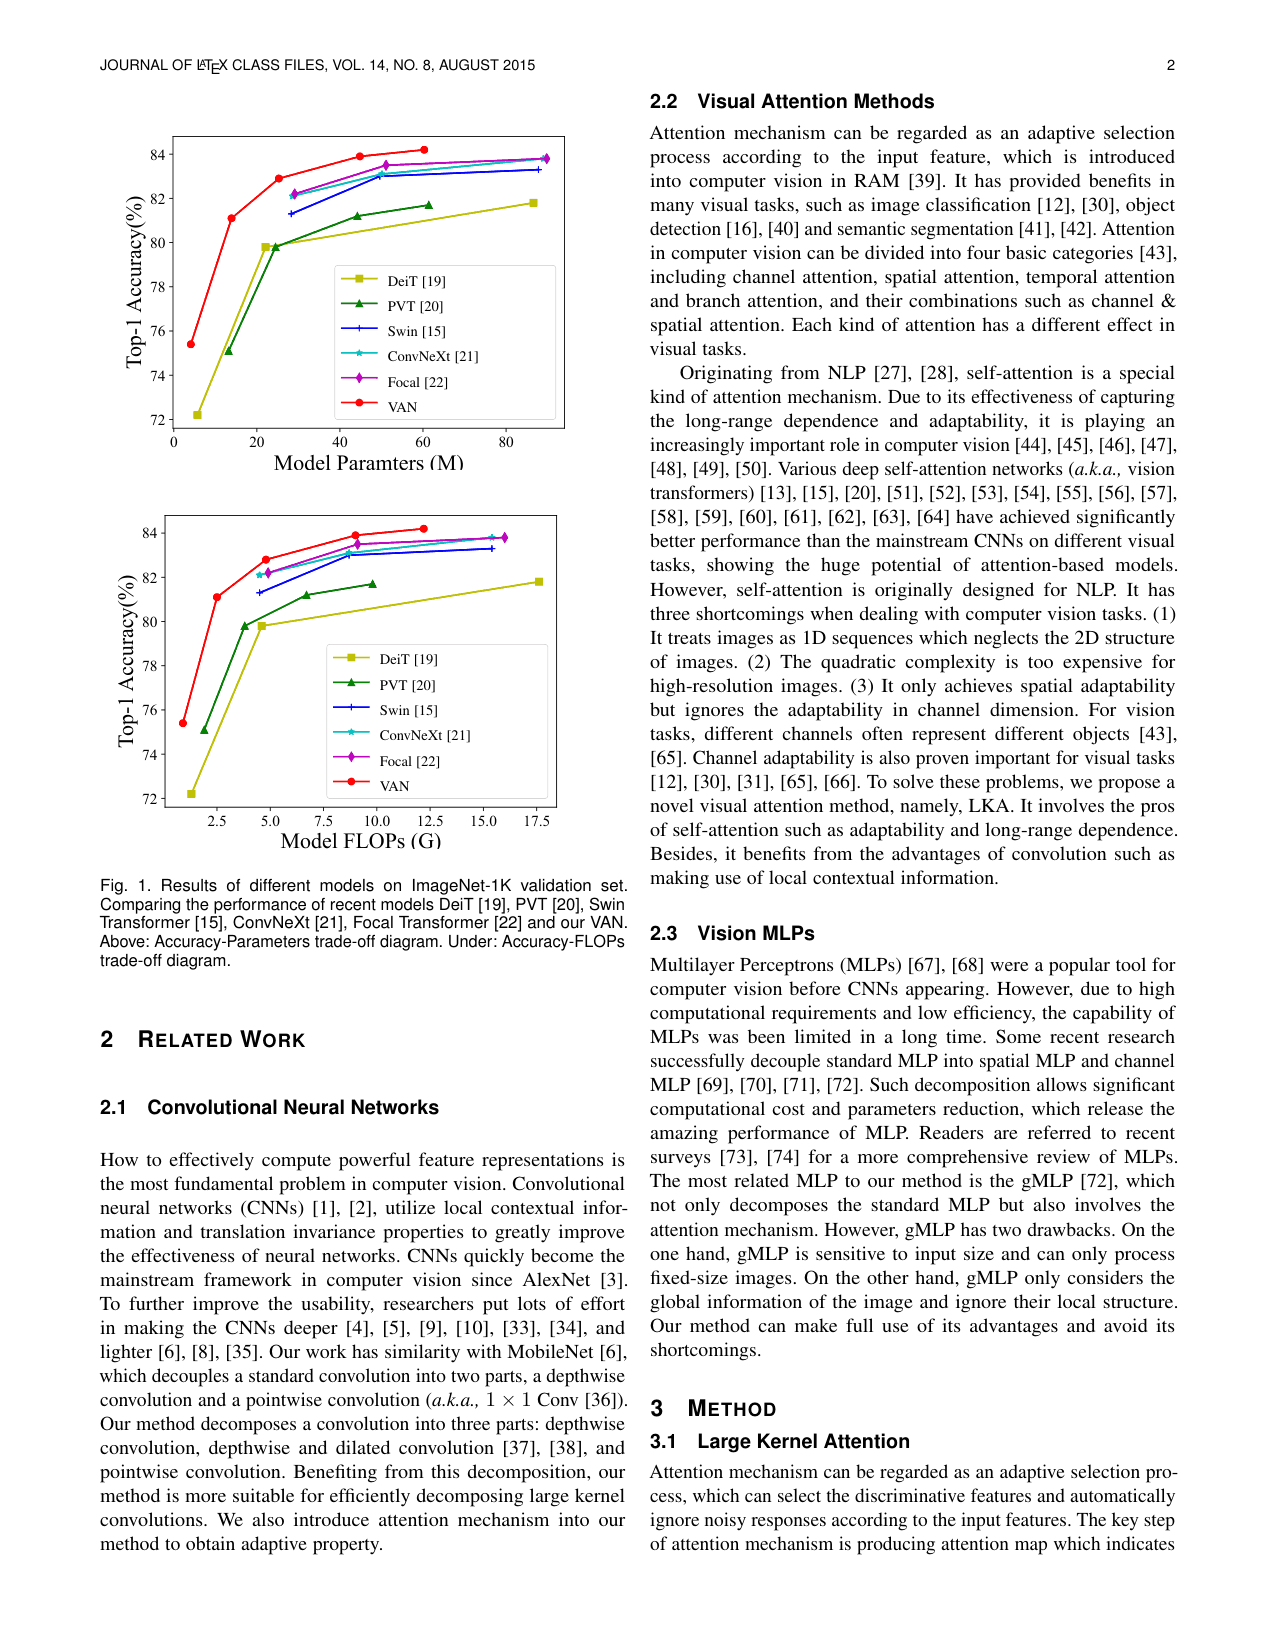
The reason multimodal didn't show a clear effect in the earlier figure evaluation is that the Attention paper's prose already explains the figures. When figures carry information that isn't in the prose — like data charts — the picture changes. The values and rankings in a bar or line chart aren't written out anywhere; you have to look at the chart to know them.
I put together a new eval set from a different paper, Visual Attention Network, which has charts. Six questions about Figure 1 — which compares accuracy across several models — asking things like "which model performs best?" and "which is lowest?" Without multimodal, only 1 of 6 (17%) is answered correctly.
I start by rendering the full page containing the chart and getting a caption from it. The score goes from 17% to 33%. But fitting the whole page into one image makes the chart small, and detail gets lost.
So I compute a bounding box around the vector shapes on the page and render just that region at a larger size. The chart fills the frame.
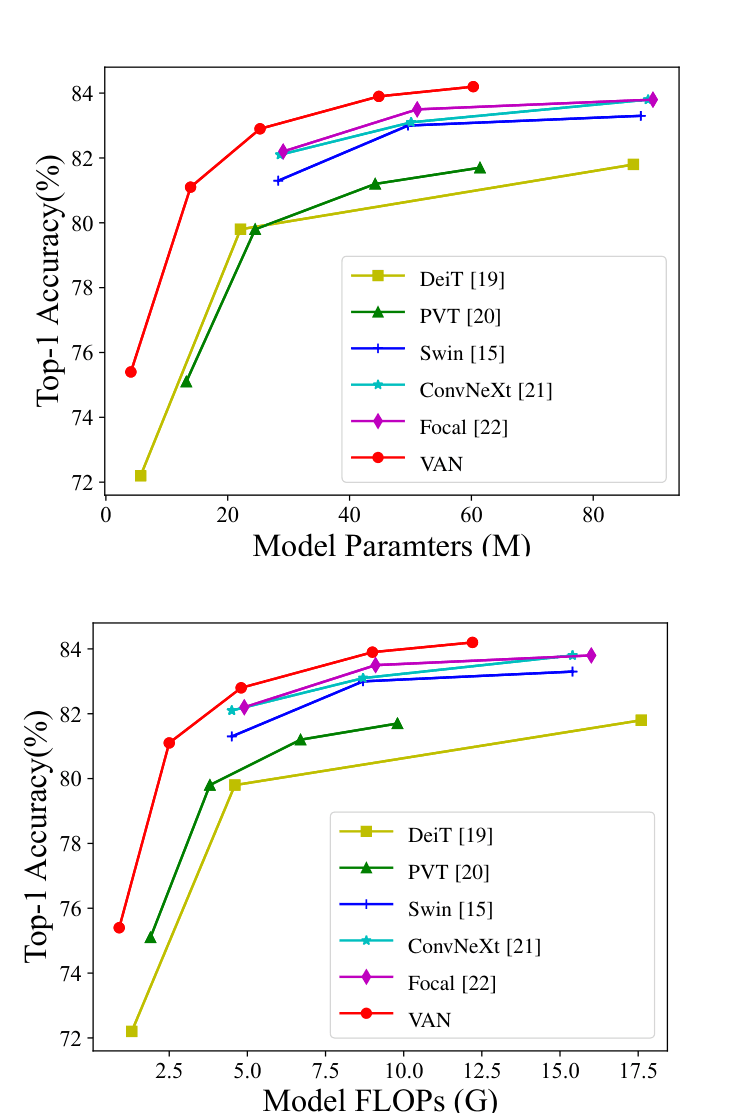
With keyword-based scoring, the crop raises the score from 33% to 50%. But that scoring passes as long as the answer contains the right model name. When I tighten scoring to "correct and not contradicted by the reference answer," the crop score falls back to the text-only level. Looking at the captions, the model is reading the chart backwards. The correct answer is VAN, but the caption says "the best model is DeiT." The 50% was an artifact of weak scoring.
So what's actually wrong? I strip away the RAG pipeline and scoring, pass the same image to different models, and ask for a caption. gpt-4o-mini says "the best is DeiT" (wrong). gpt-4o says "the best is VAN" (correct). The small model simply can't read this chart.
Scaling up raises cost concerns. But when I measure actual tokens, the picture is different. gpt-4o-mini converts images into more tokens — about 25,000 for this one image — while gpt-4o uses about 800. Even though gpt-4o is more expensive per token, the cost per caption ends up roughly the same. And captioning only happens once at indexing time. I switch the figure captioning model to gpt-4o. The captions now read "VAN is highest at roughly 84%," and the chart question score climbs from 1 of 6 correct to 4 or 5.
To summarize: cropping sharpened the image, but the real problem was always the captioning model. And keyword-based scoring made an absent improvement look present. Doubting the measurement tool first was the right call.
Indexing Speed
As features accumulate, uploading slows down. The culprit is figure captioning. Sending 8 figures one at a time takes 17.6 seconds for that step alone; since the caption calls are independent, sending them all at once brings it down to 5.1 seconds.

That said, too many concurrent requests will hit the rate limit, so I cap concurrency within the allowed limit. I also make the upload accept the job immediately and process it in the background with a progress indicator — so the same elapsed time feels like progress rather than a freeze.
Wrapping Up
Starting from a text-only chatbot, I worked through tables, figures, evaluation, retrieval, and speed one at a time. Here's what I learned:
- Extracting a table doesn't improve scores if the numbers are already in the body text. Extraction and having the content reflected in answers are two different things.
- Figures have no text, so I use VLM captions to convert them into text. The effect is hard to see when the paper's prose already describes the figures; the real benefit shows up with charts and other figures that carry information not written in the prose.
- Cropping to enlarge the chart wasn't enough on its own. The small captioning model was reading charts backwards; switching to
gpt-4ofixed it, at roughly the same cost per caption. - Mixing captions into the same search space causes retrieval interference. Narrowing by query intent solves it.
Measuring each step against a small eval set was what let me make decisions. Without measurement I would have counted useless work as progress. At one point the measurement tool itself was wrong, and only after fixing that did the real problem become visible.
This was a small project I built for myself, but I could already see several more areas to improve beyond tables and figures. It would be fun to polish it up and actually deploy it so others could use it.
This post may contain factual or interpretive errors. If you spot anything wrong or have a question, feel free to leave a comment.
Reference
- Attention Is All You Need (2017) — the Transformer paper used as an example throughout
- Visual Attention Network (2022) — the paper used in the chart-reading experiments